
Rainfall Estimates on a Gridded Network (REGEN)
Steefan Contractor
Contractor, S., Donat, M. G., Alexander, L. V., Ziese, M., Meyer-Christoffer, A., Schneider, U., Rustemeier, E., Becker, A., Durre, I., and Vose, R. S.: Rainfall Estimates on a Gridded Network (REGEN) – a global land-based gridded dataset of daily precipitation from 1950 to 2016, Hydrol. Earth Syst. Sci., 24, 919–943

Basic description
- Daily estimates over 1950 - 2016
- Gridded 1 degree latitude x 1 degree longitude resolution
- Global land coverage
Purpose
- Purpose built for climate studies with a long temporal record and consistent global spatial analysis
- Based on a large in situ archive from combining GPCC with GHCN-Daily among others
- Includes various statistical model error estimates
- Also includes guidance for users less aware of issues with in situ based precipitation observations
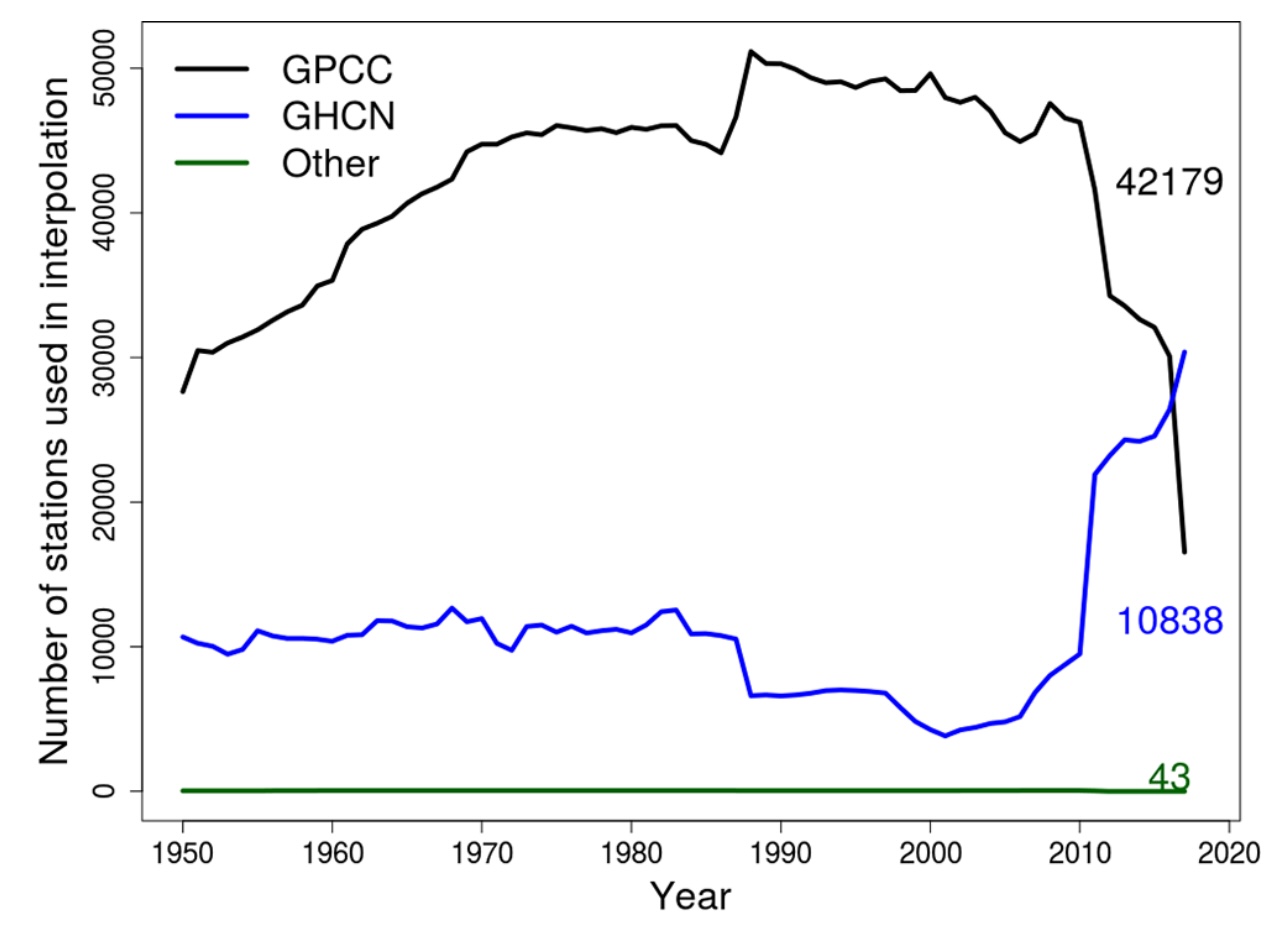
In Situ Station Archive Description
- Total stations: 135,178
- Around 50K stations for each day
- Min stations per day: 35,460
- Max stations per day: 56,190
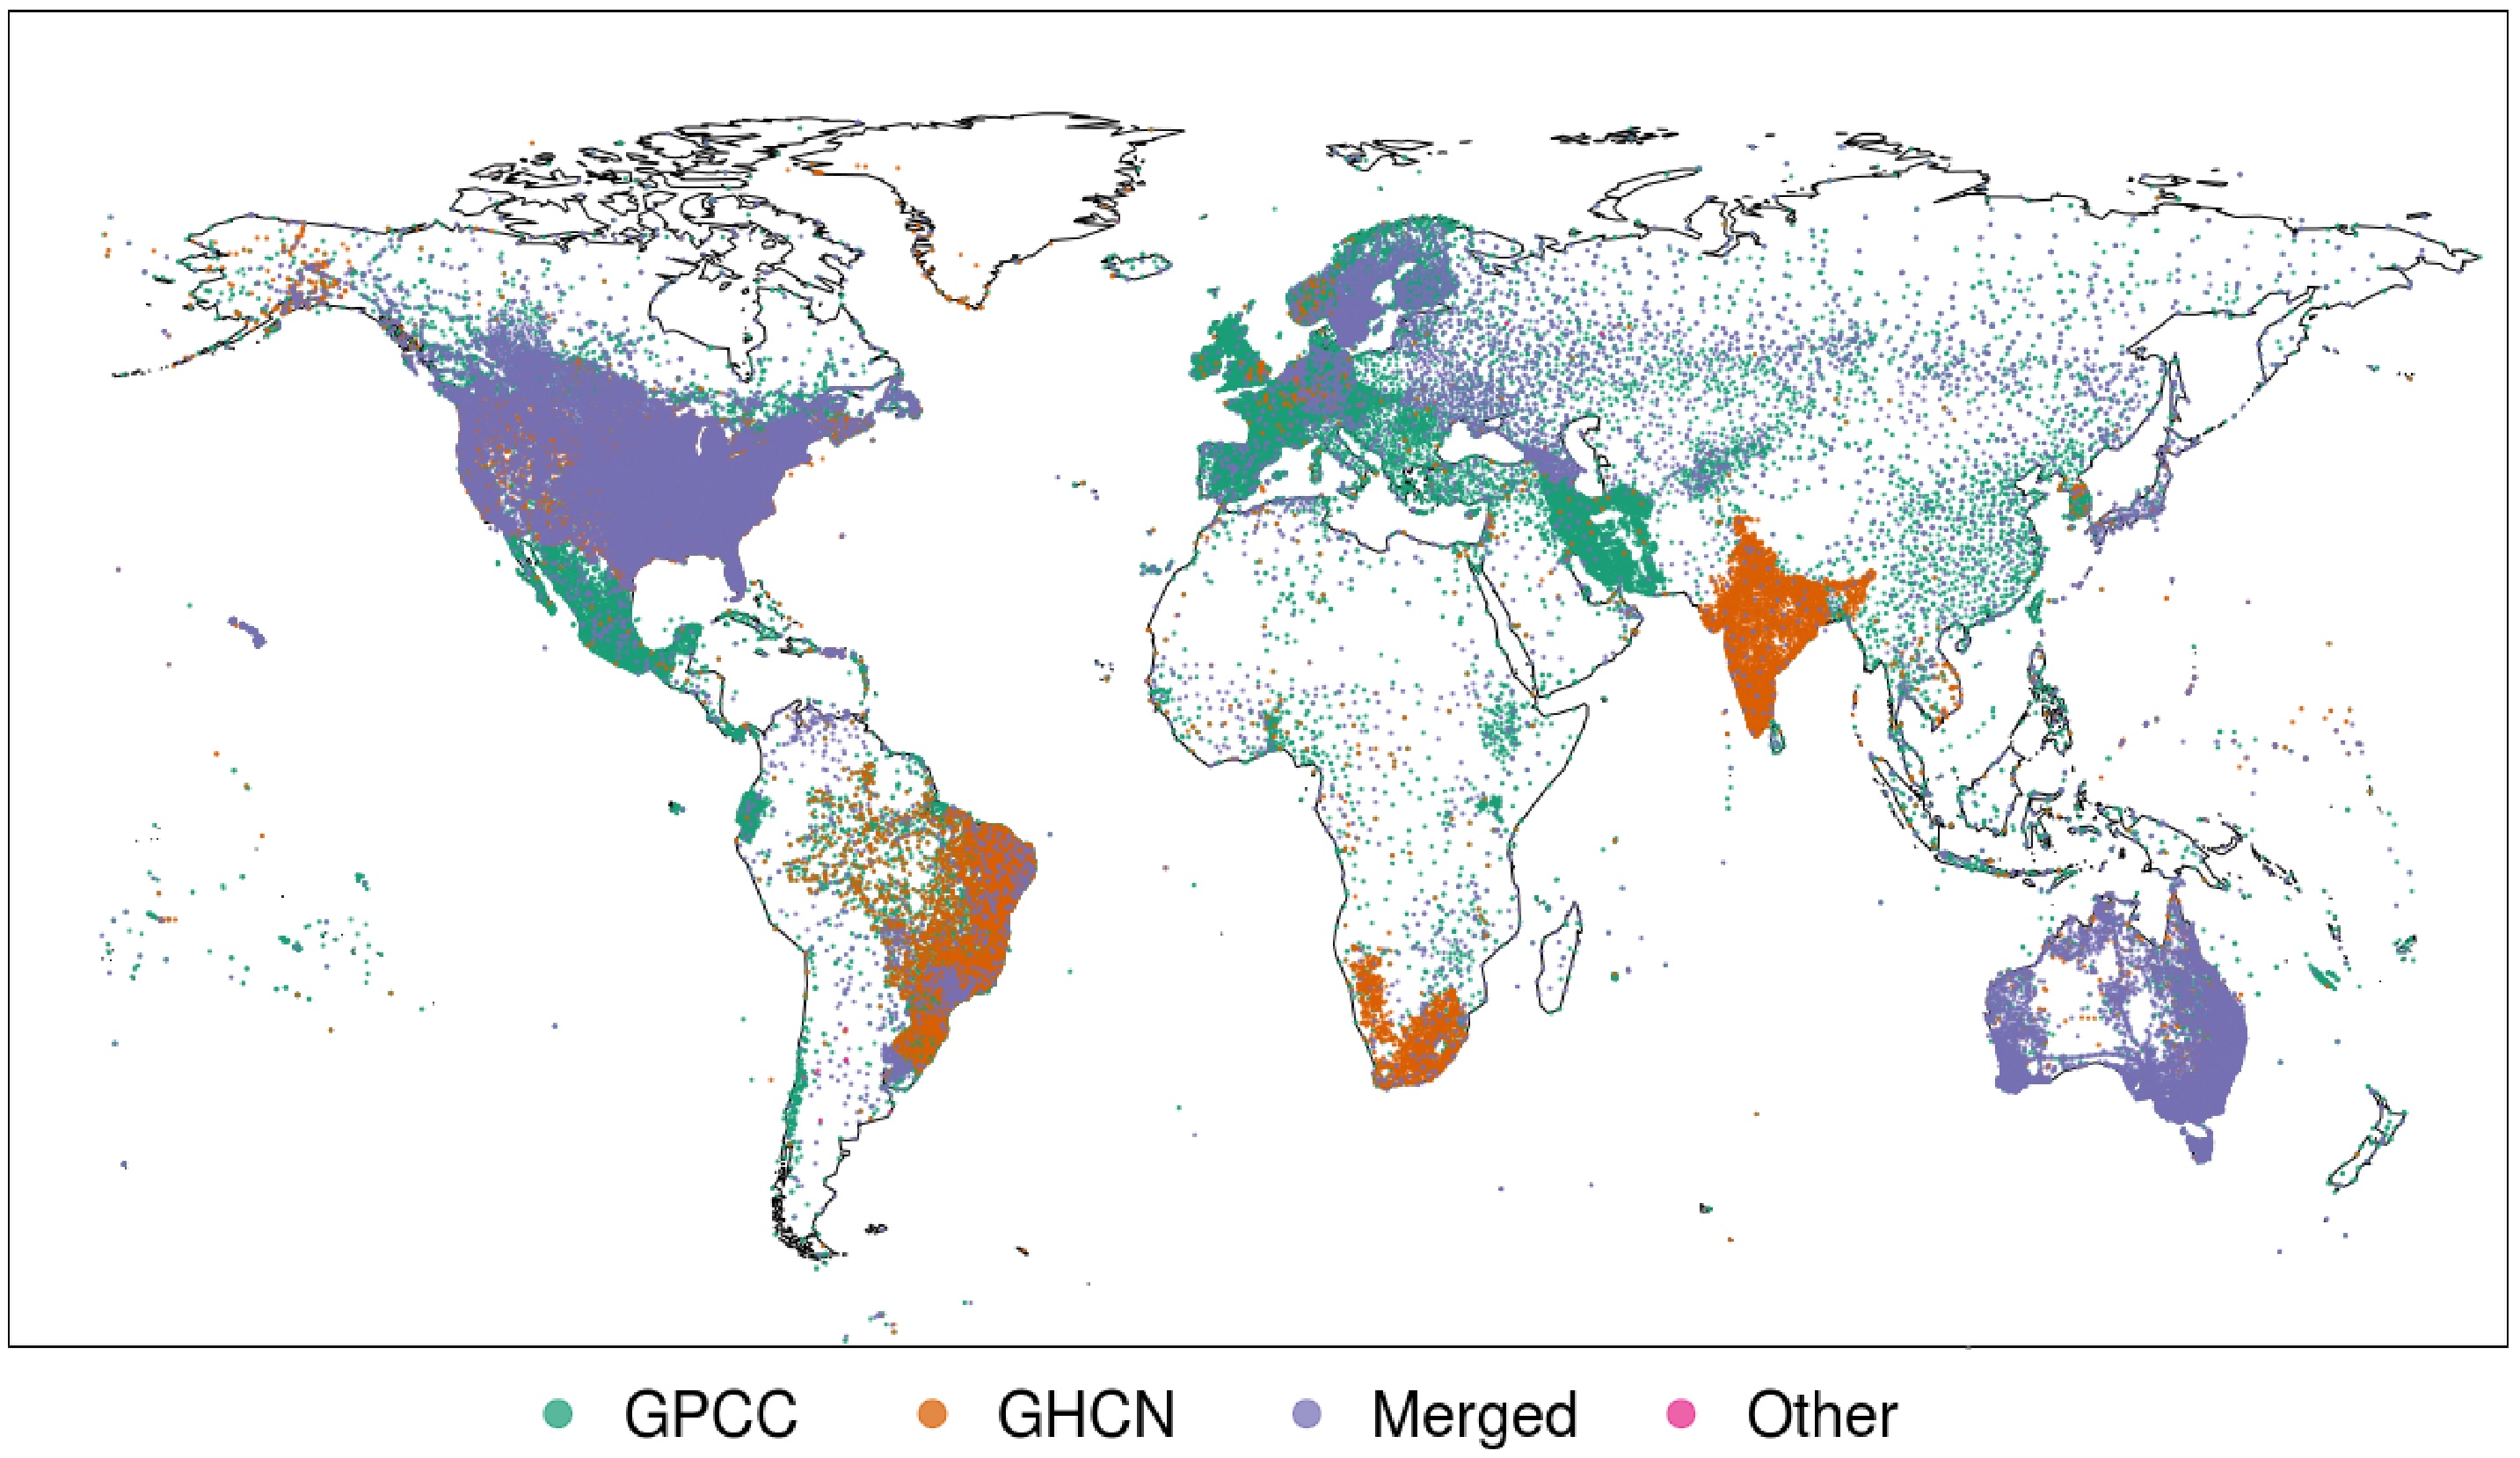
Component In Situ Archives
Three sources:
- GPCC stations
- GHCN-Daily stations
- Collected during GEWEX workshops
Merging algorithm:
- Lat + Lon match and
- World Met. Org. (WMO) ID match or missing
Or
- Coordinates within 1º of each other and
- WMO ID match or missing and
- 0.99 correlation between timeseries with 365 days of data of which at least 10d with >1mm precip
Quality Control Procedures
- The automated QC procedures were identical to those applied to GHCN-Daily (Durre et al. 2010)
- The procedure included two stages
- Stage 1 does temporal checks
- multi-day accumulations
- duplicate data within timeseries
- frequent occurance of values
- world record exceedances
- outlier checks
- temporal consistency checks
- Stage 2 does spatial checks
- checks whether values are consistent with negihbours
Durre, I., Menne, M. J., Gleason, B. E., Houston, T. G., and Vose, R. S.: Comprehensive automated quality assurance of daily sur- face observations, J. Appl. Meteorol. Clim., 49, 1615–1633
Interpolation Algorithm
- Ordinary Block Kirging
- Best Linear Unbiassed Estimator (BLUE)
- Linear because the estimate is a weighted average of surrounding stations
$$\mathbf{Z}^*(s_0) = \sum_{i=0}^{N} λ_i\mathbf{Z}(S_i)$$
- Best because we use the spatial structure (covariance) to determine the value of the weights
- Unbiassed because the weights are constrained to add up to 1 and so the result cannot be biassed to any one station
$$\sum_{i=1}^N λ = 1$$
- Ordinary Kriging assumes second order stationarity (mean and variance constant across domain)
$$\mathbf{Z}^*(s_0) = μ + ε(s_0)$$
- Block implies that the algorithm produces gridded area-average estimates as opposed to point estimates
Two Flavours: All stations and Long Term Stations Only
- The All stations based dataset interpolates all underlying stations
- The Long Term version interpolates only stations with 40 complete years of data
- A year is complete if all 12 months had at least 70% non-missing days
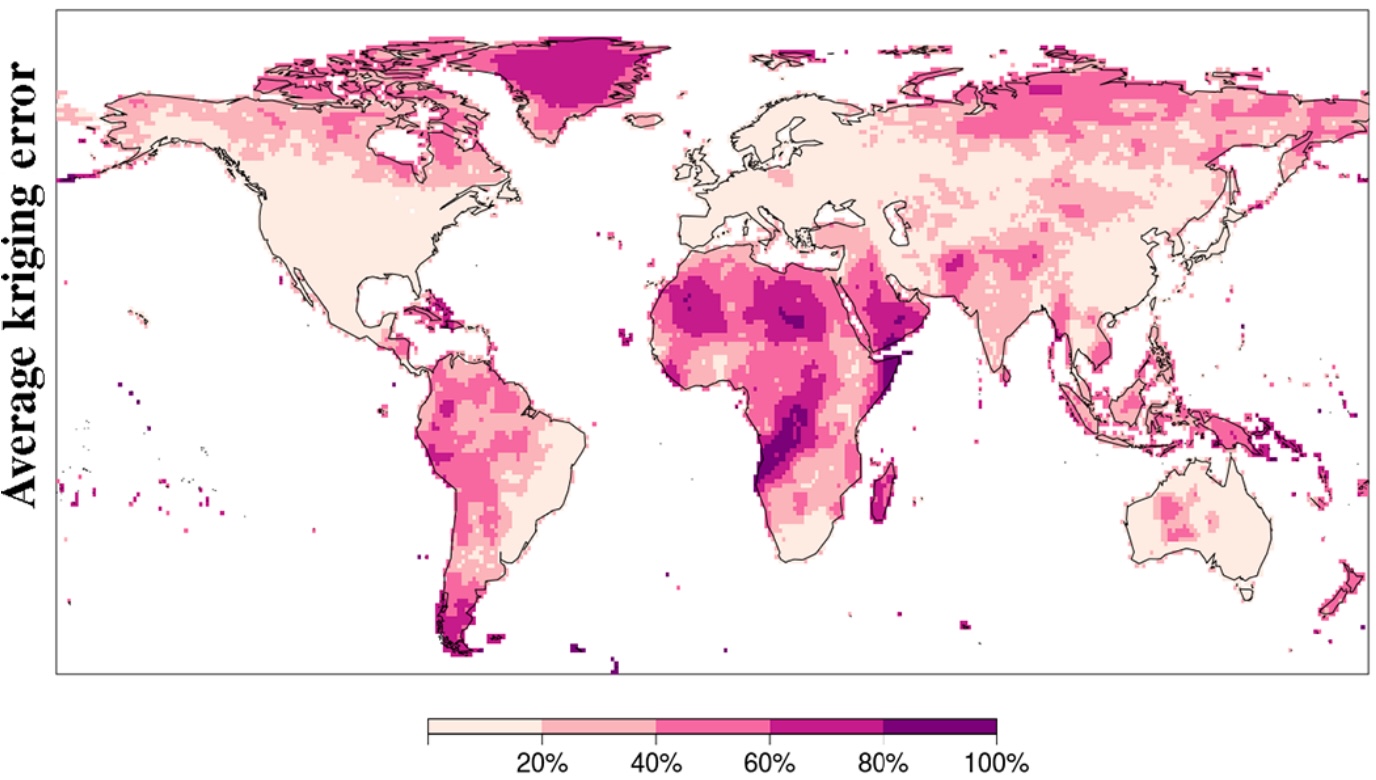
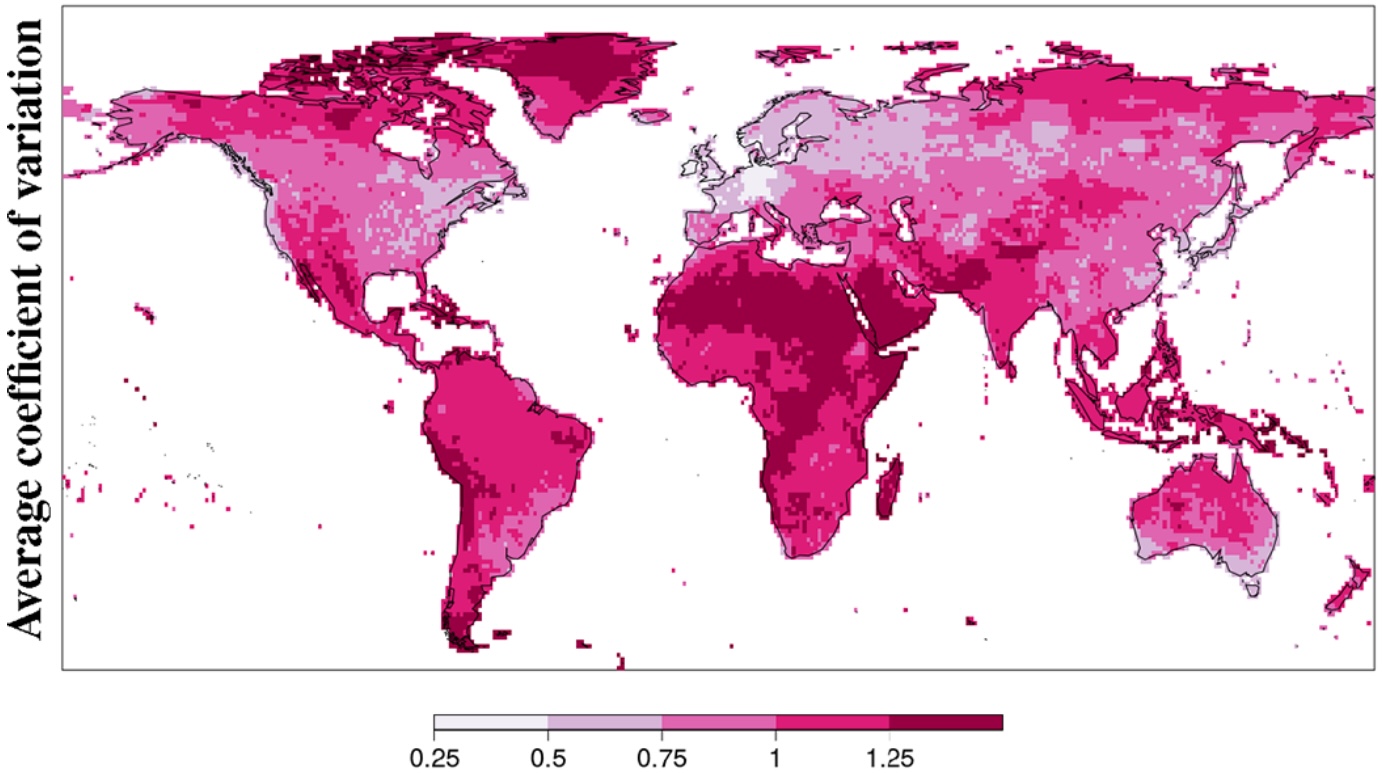
Uncertainty aware guidance for users
- The uncertainty info includes Kriging Error (KE): a weighted average of modeled variance (between interpolation location and stations) and depends solely on the spatial distribution of stations and grid size, and
- Yamamoto coefficient of variation (CV) (Yamamoto et al. 2000): weighted (by Kriging weights) average error between the estimate and the station values
- Number of stations used for each grid estimate is also included
Yamamoto, J. K.: An Alternative Measure of the Reliability of Ordinary Kriging Estimates, Math. Geol., 32, 489–509
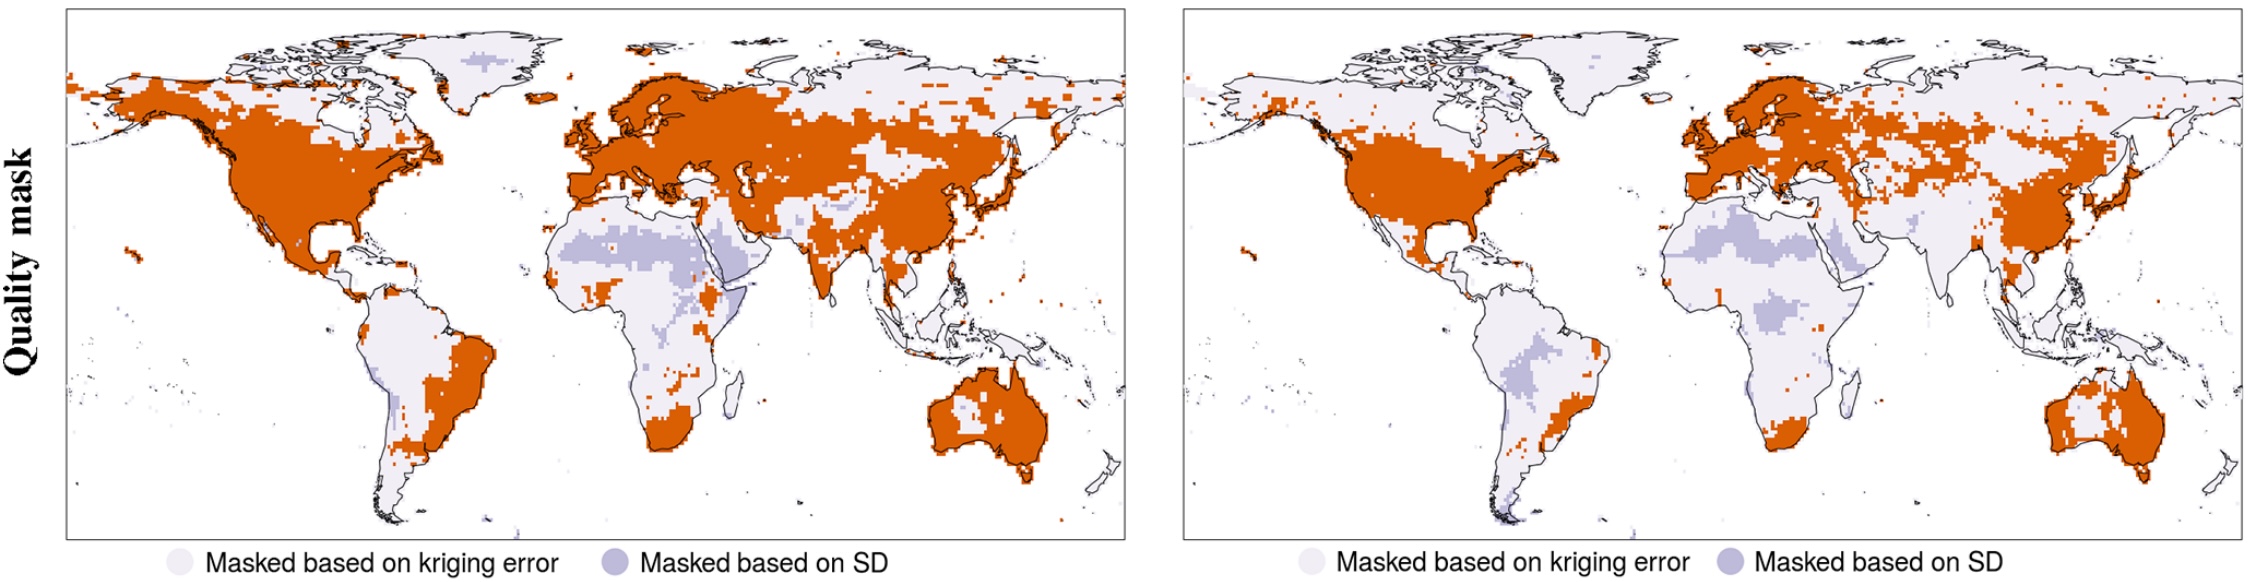
Quality Masks
A grid cell was left unmasked if:
- It contained 60% of days in every decade with at least 1 station, and
- both the KE and CV were under the 95th percentile (spatial distribution) of the temporally averaged (over 1950 - 2016) KE and CV respectively
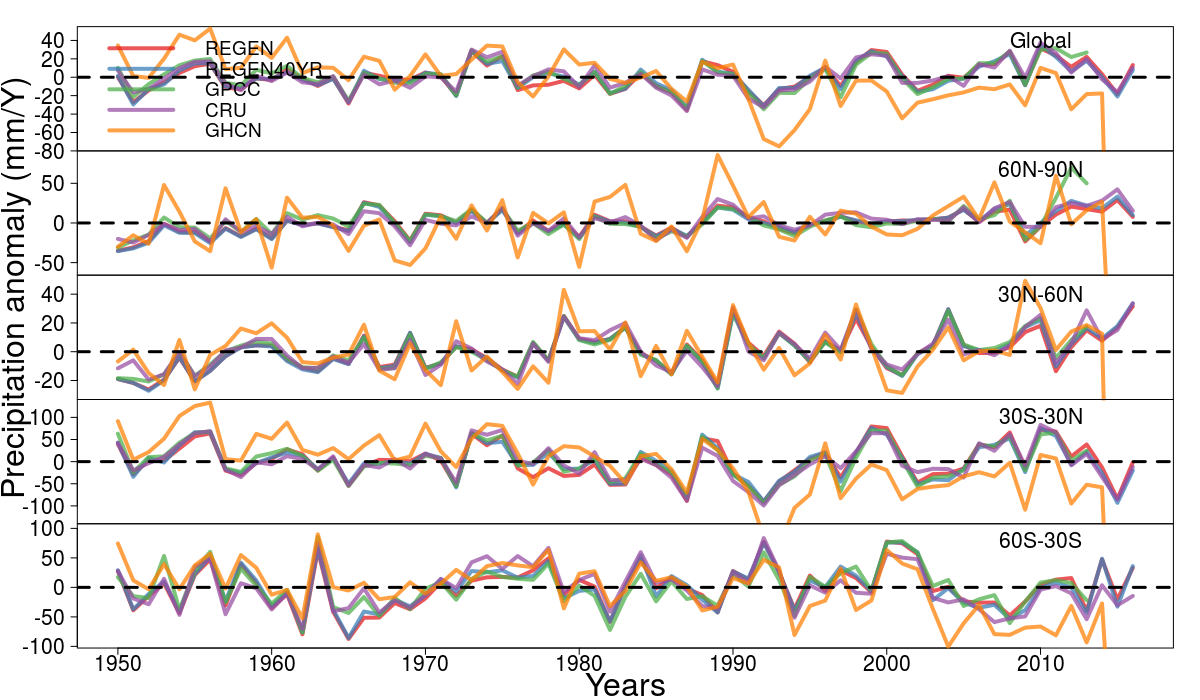
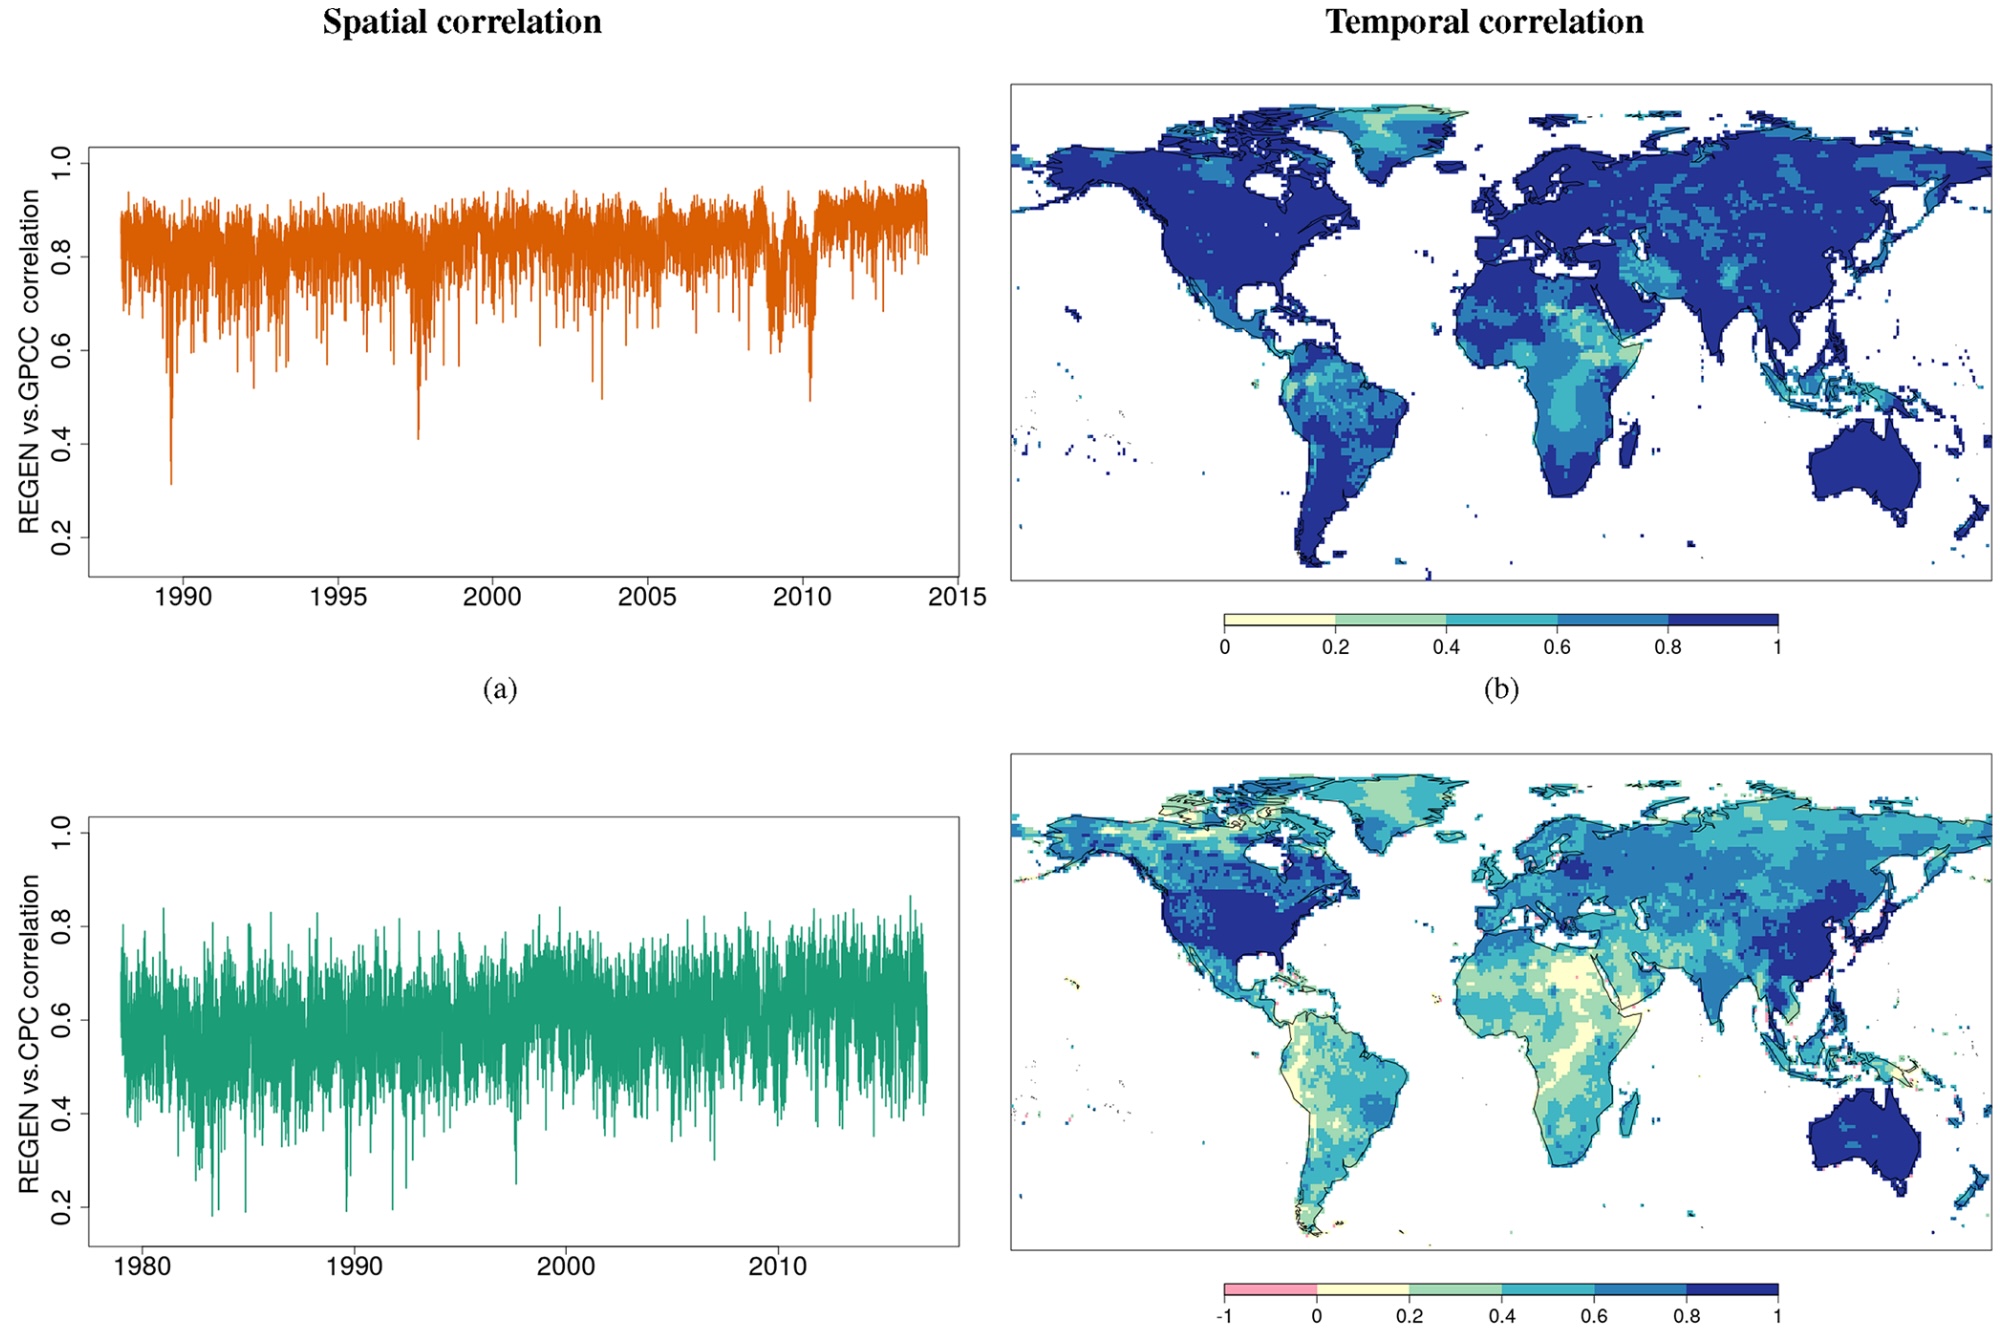
Comparison with other global gridded datasets of monthly precipitation
Comparison with other global gridded datasets of daily precipitation
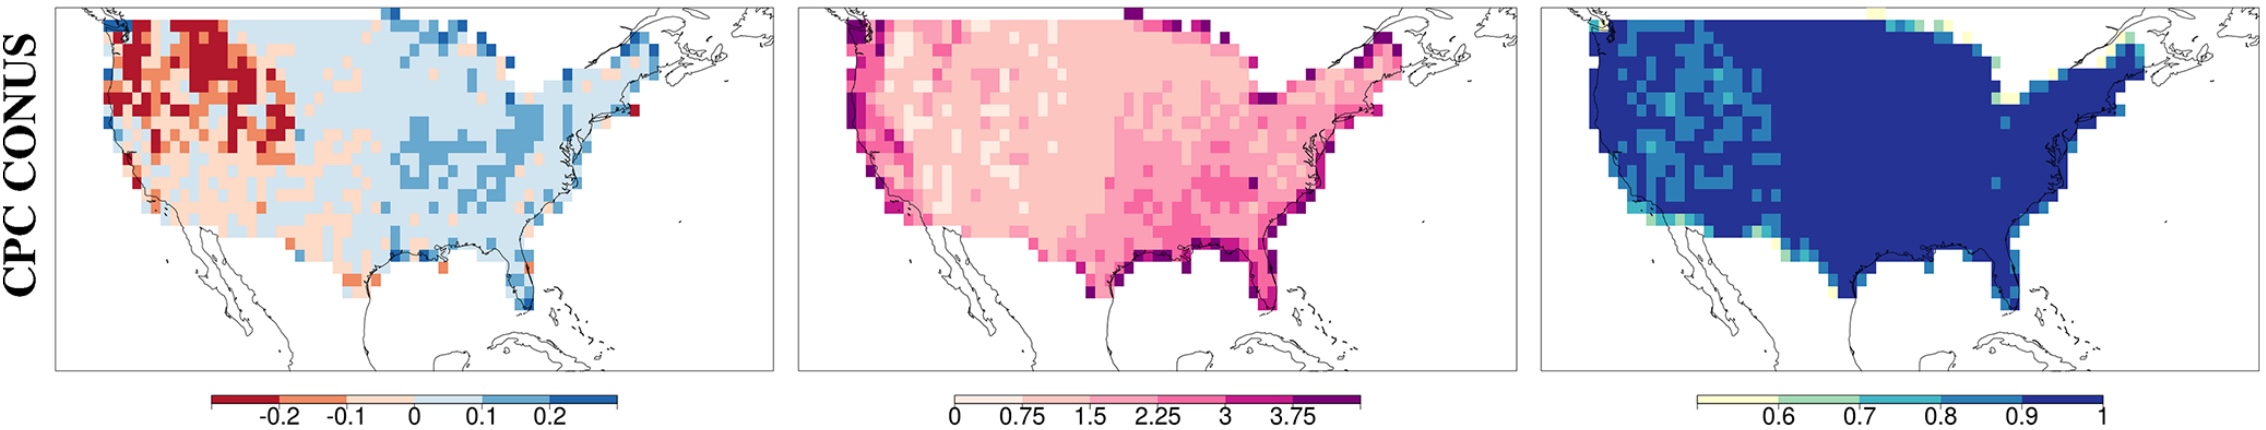
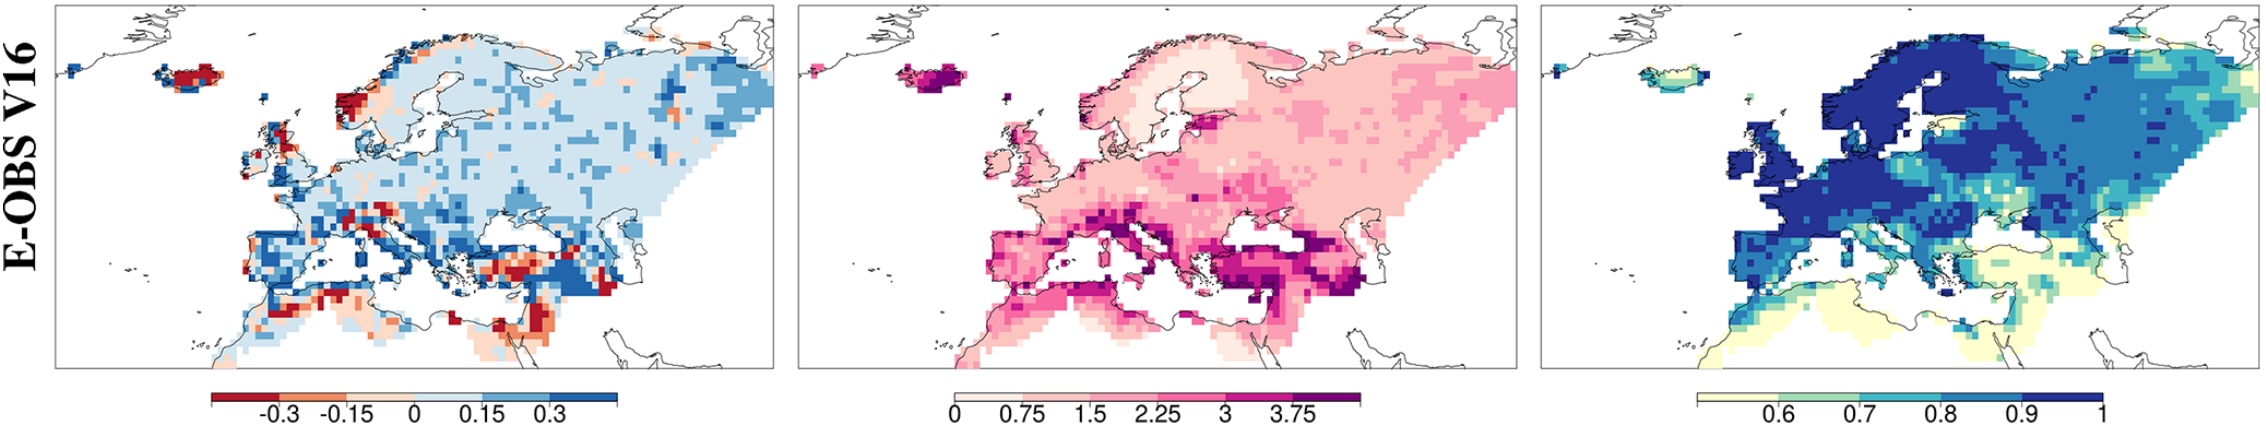
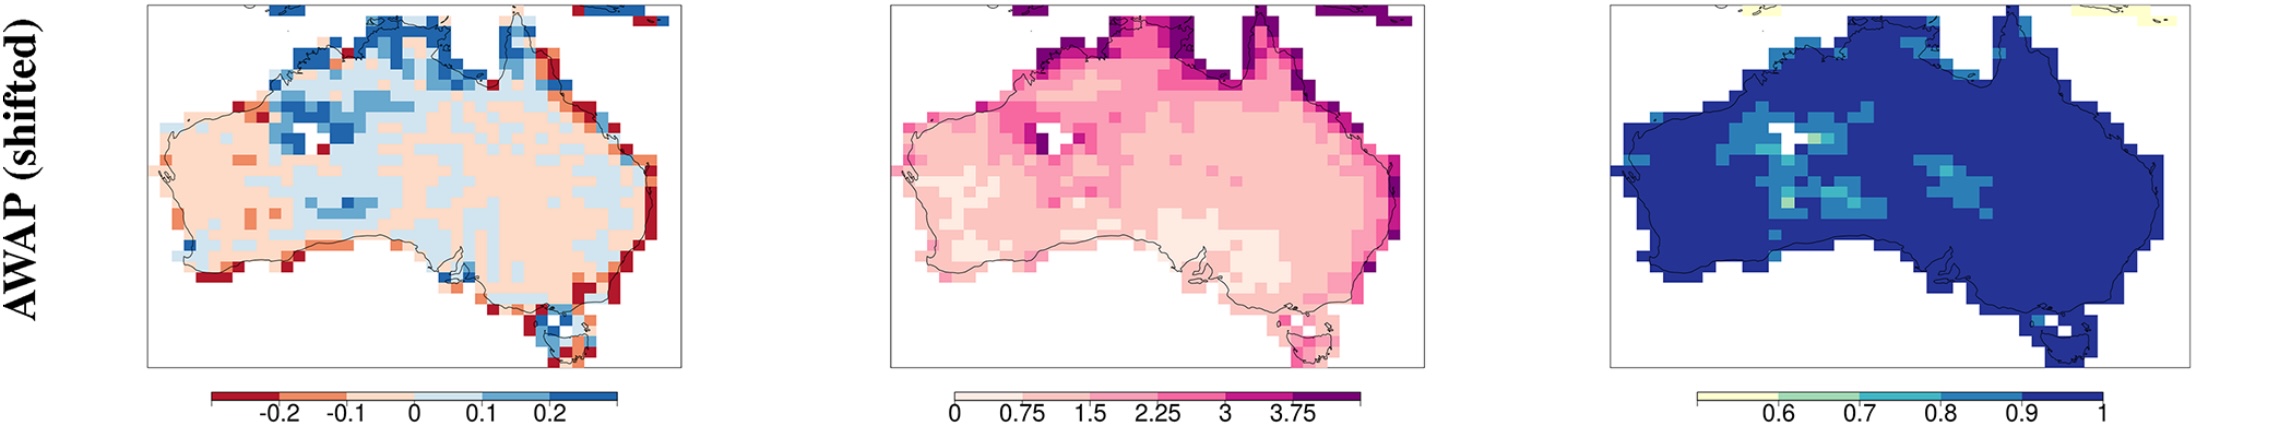
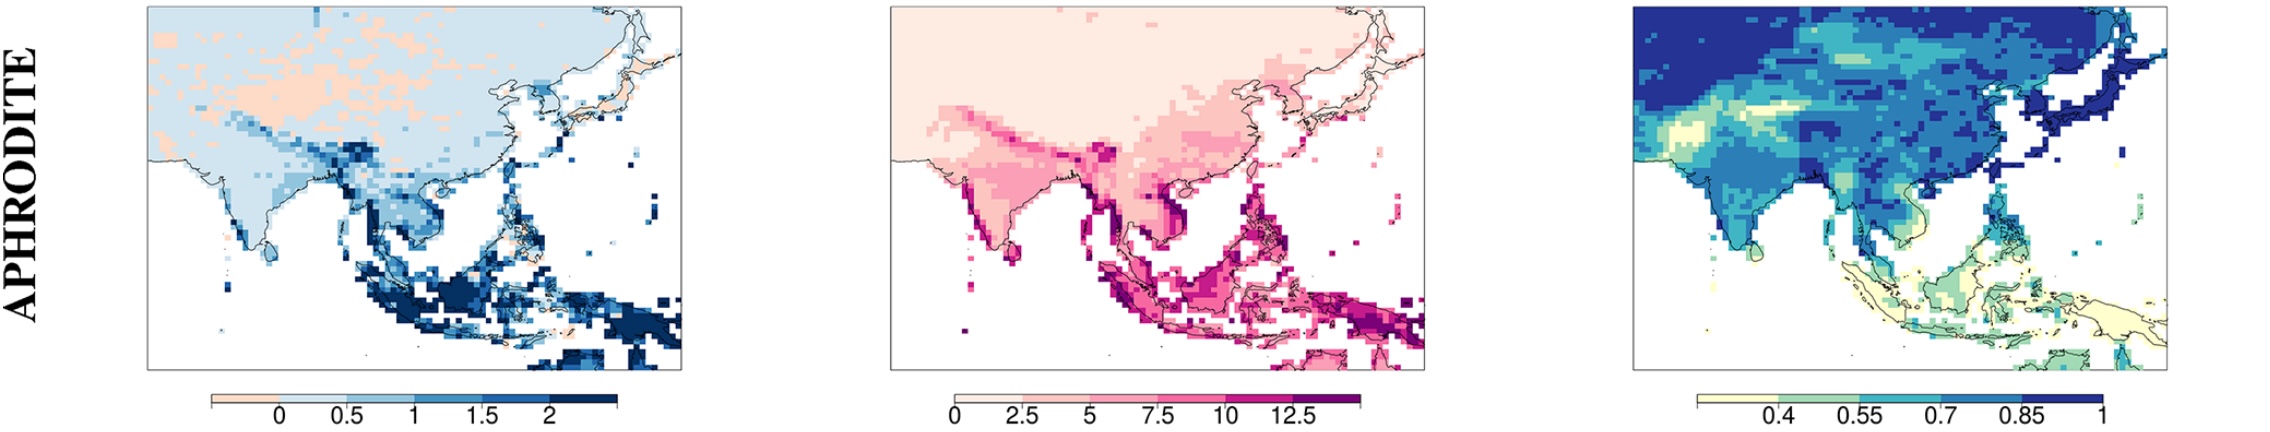
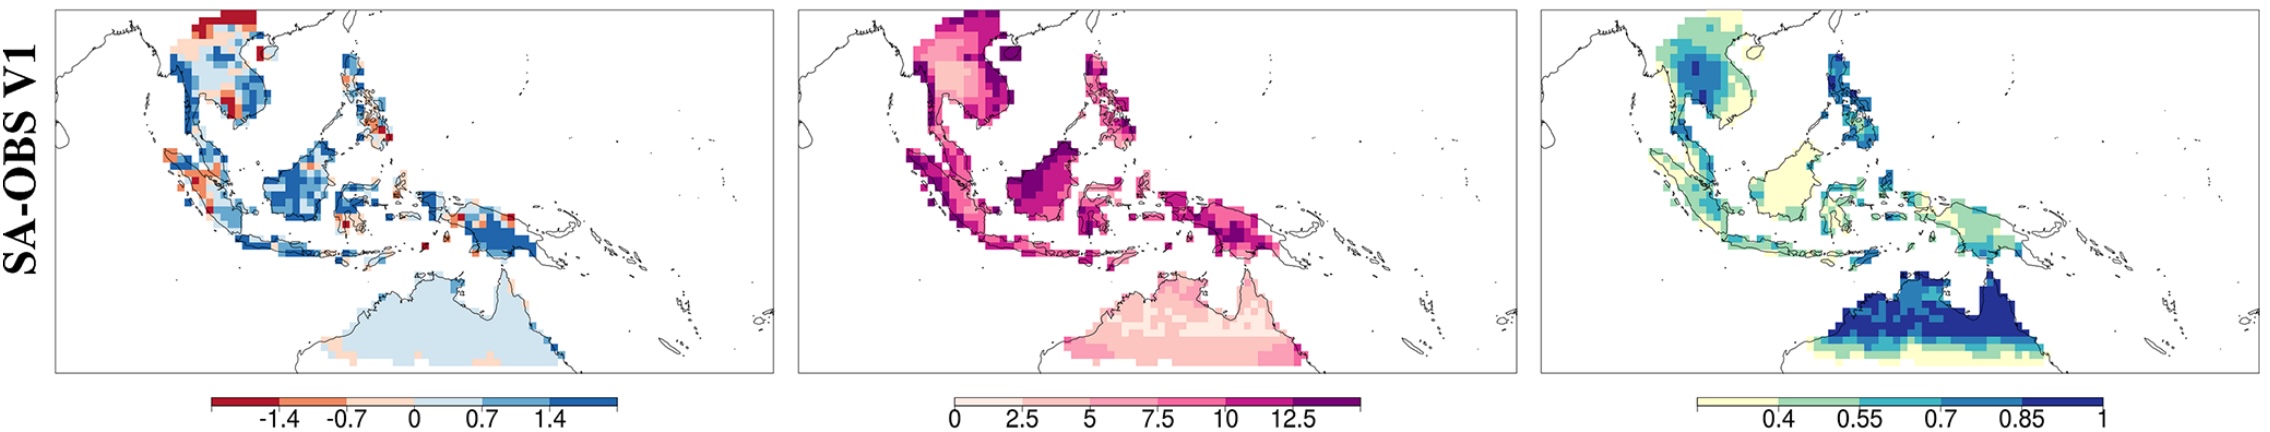
Comparison with regional daily precipitation datasets
Mean difference
SD of difference
Temporal correlation
Application: Global changes in precipitation
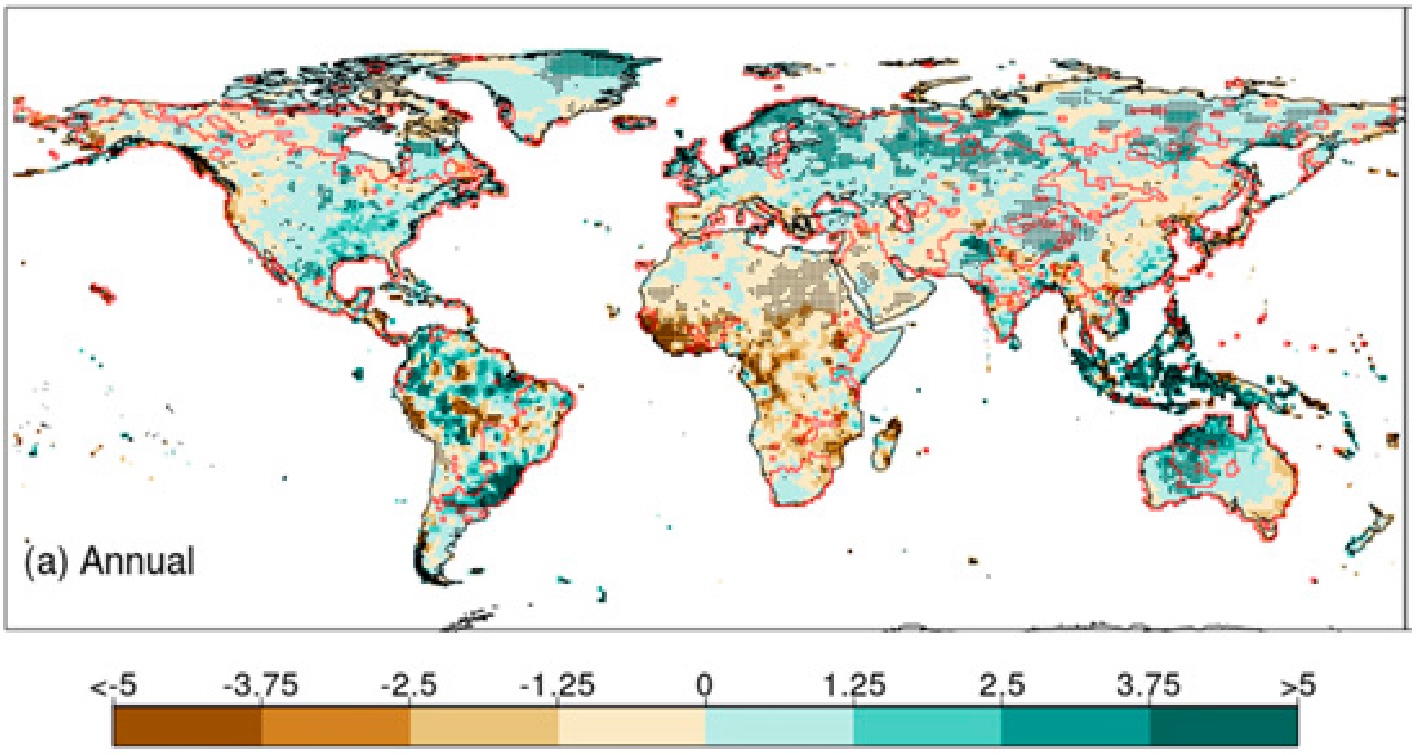
Trends in annual precipitation (1950 - 2016) (mm/yr)
Contractor, S., Donat, M. G., & Alexander, L. V. (2021). Changes in Observed Daily Precipitation over Global Land Areas since 1950. Journal of Climate, 34(1), 3–19.
Wet-day frequency changes between 1950-1983 and 1984-2016 (%)
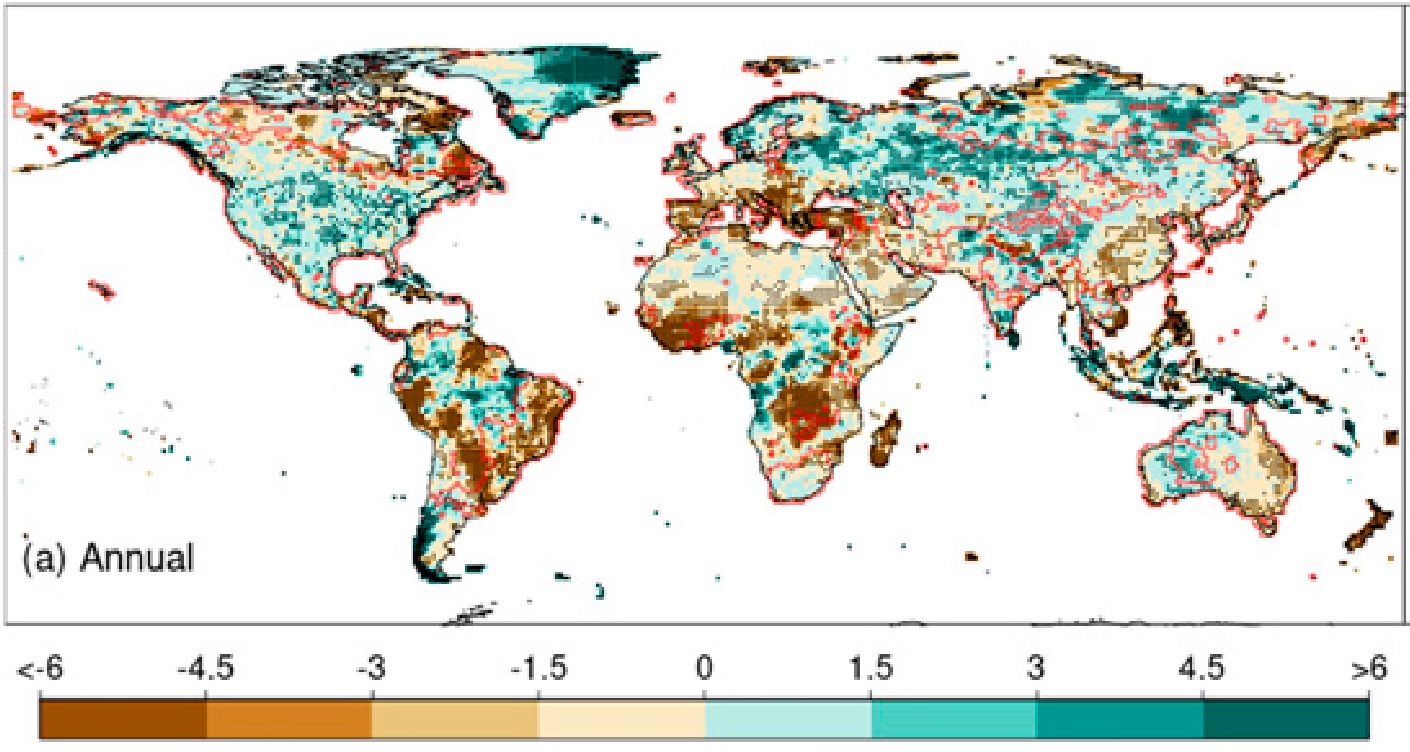
Mean precipitation intensity changes between 1950-1983 and 1984-2016 (%)
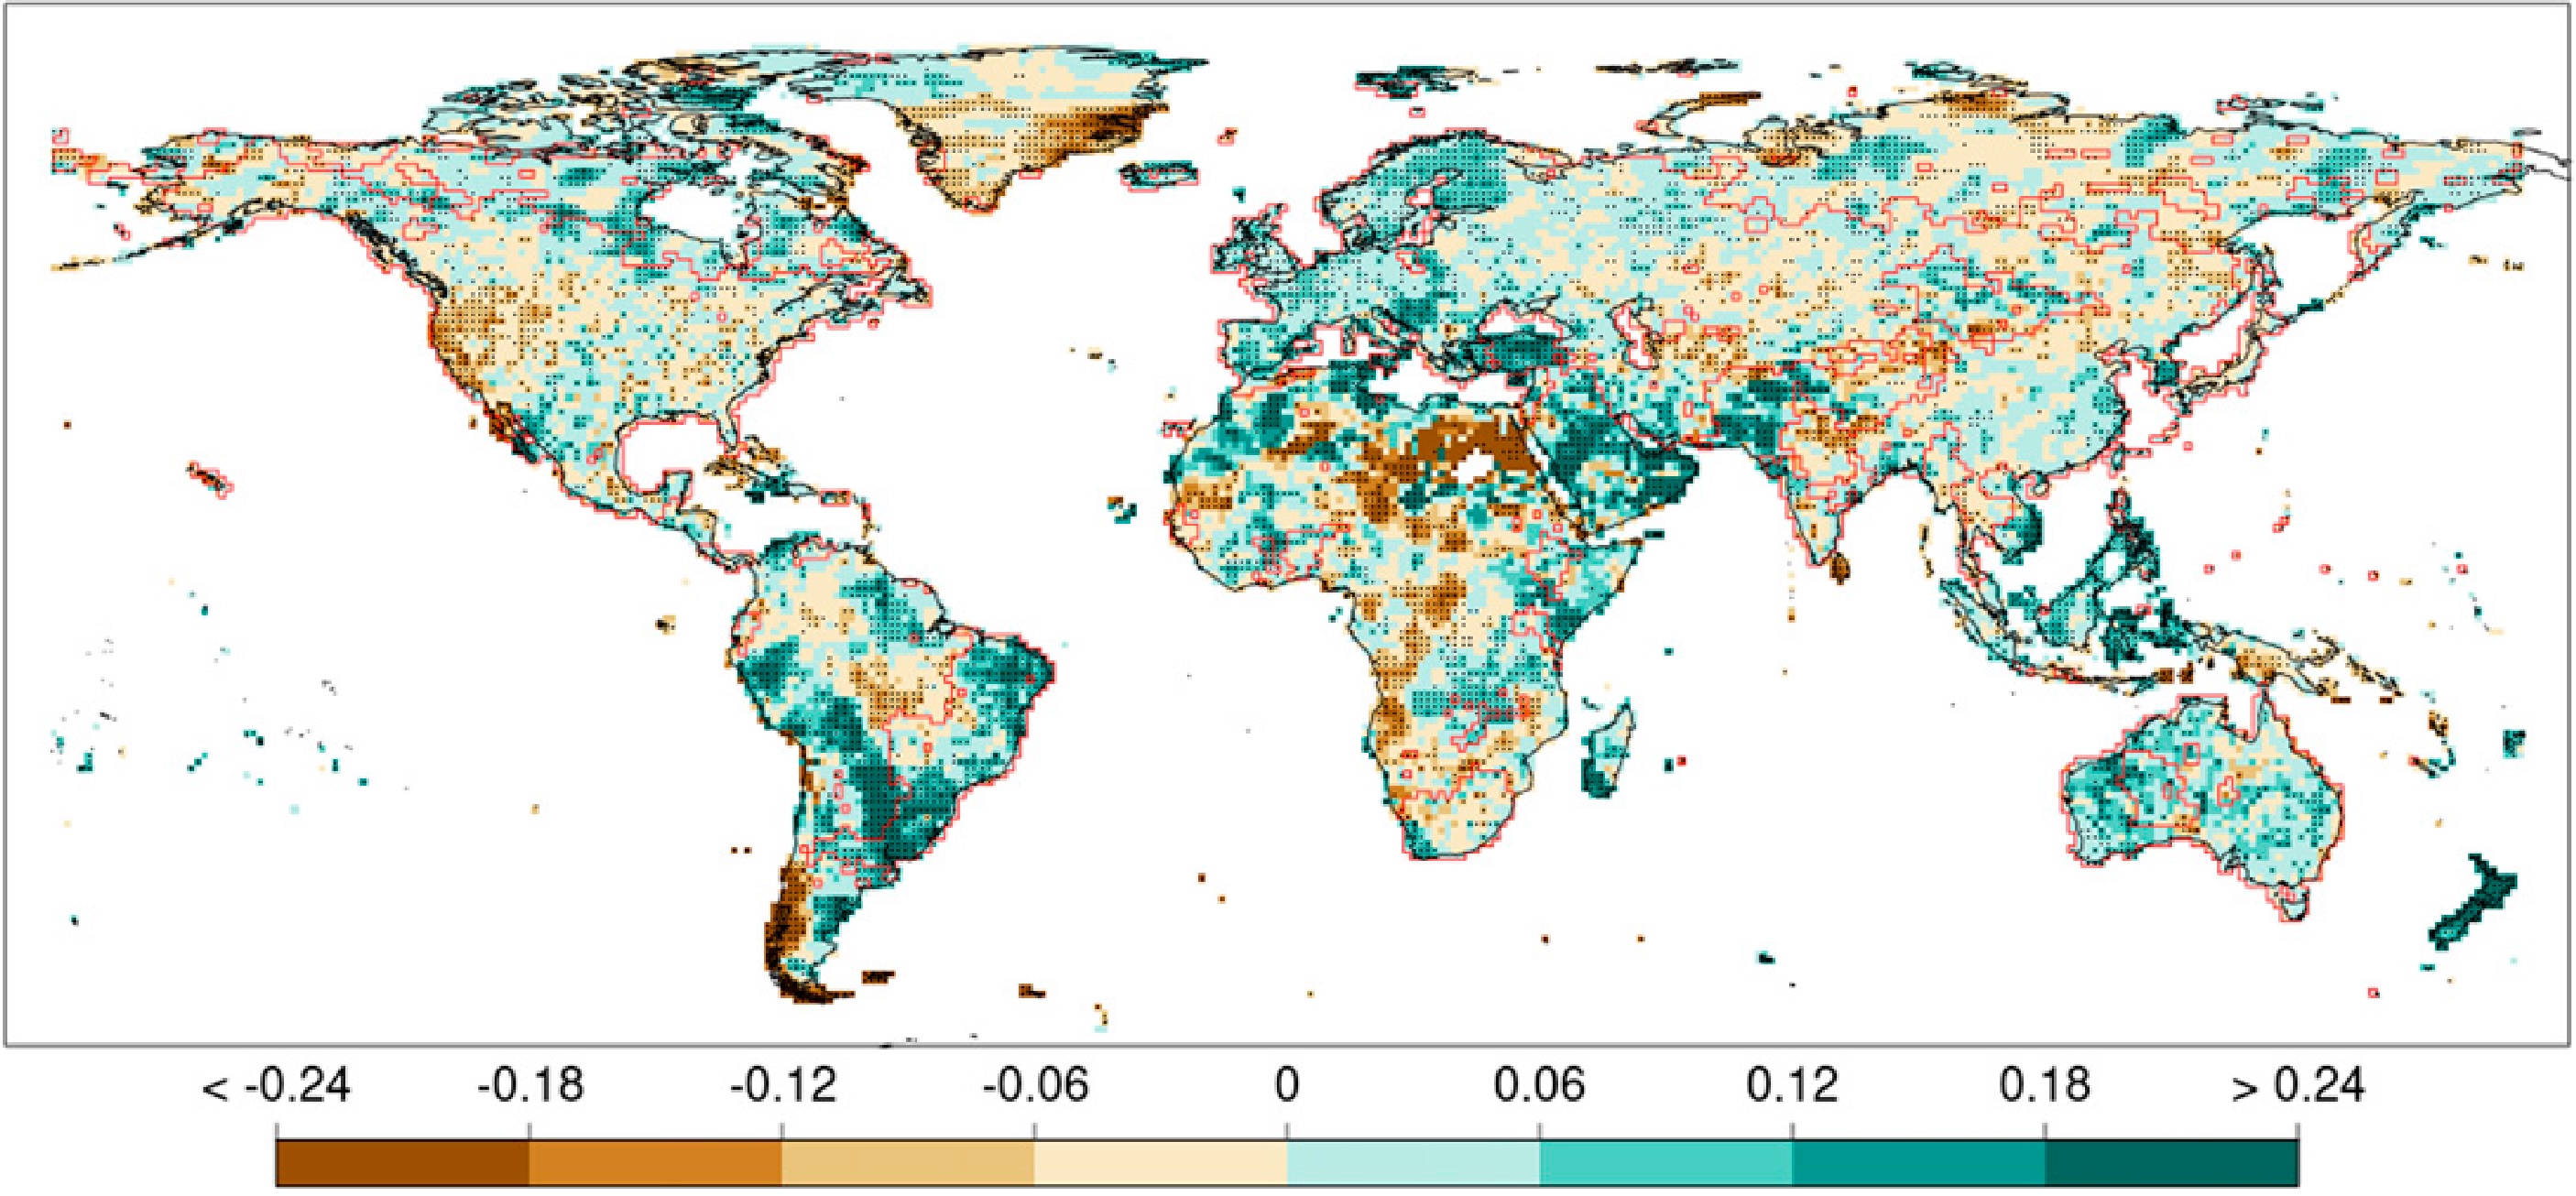
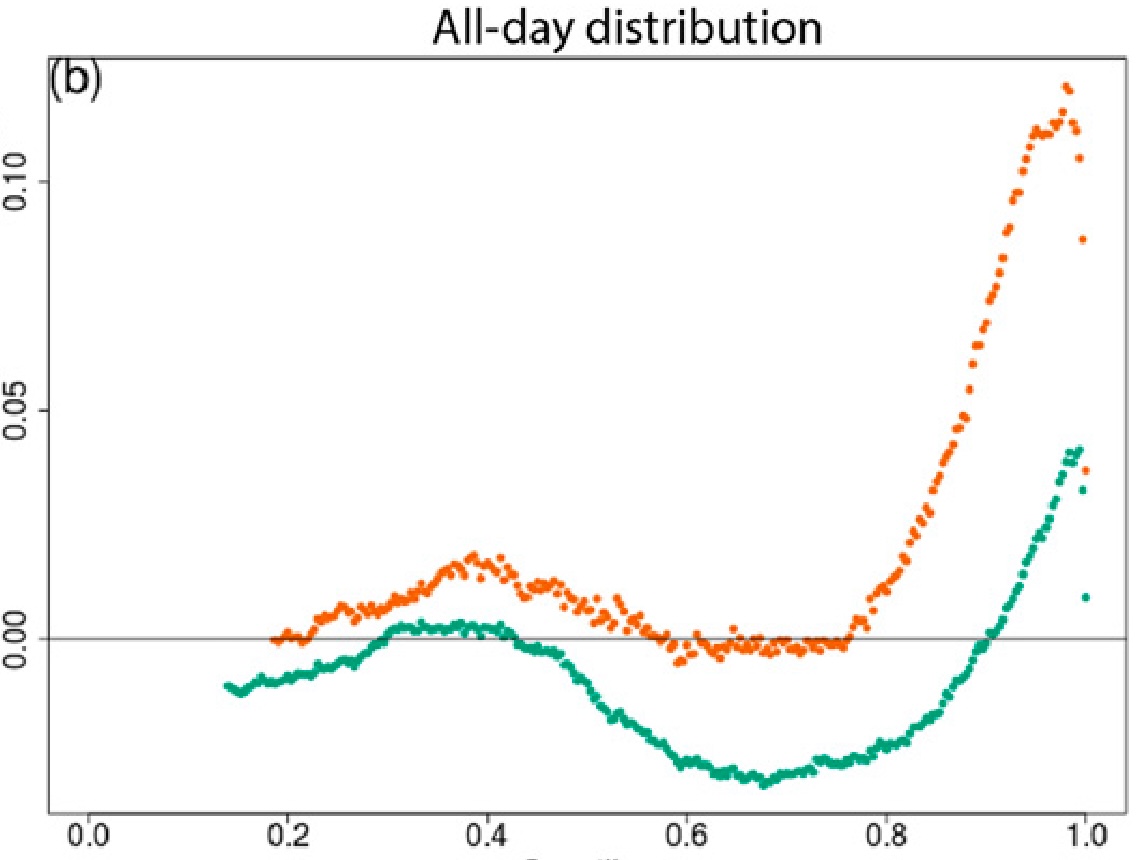
Changes across the precipitation distribution between 1950-1983 and 1984-2016
- Spatially, changes in precipitation seem complex, even stochastic at first
- But a clear signal of positive precipitation changes in the high quantiles consitent with thermodynamic expectations is apparent
- This signal dissappears for the most extreme precipitation again
Relative difference in area showing postive changes vs area showing negative changes
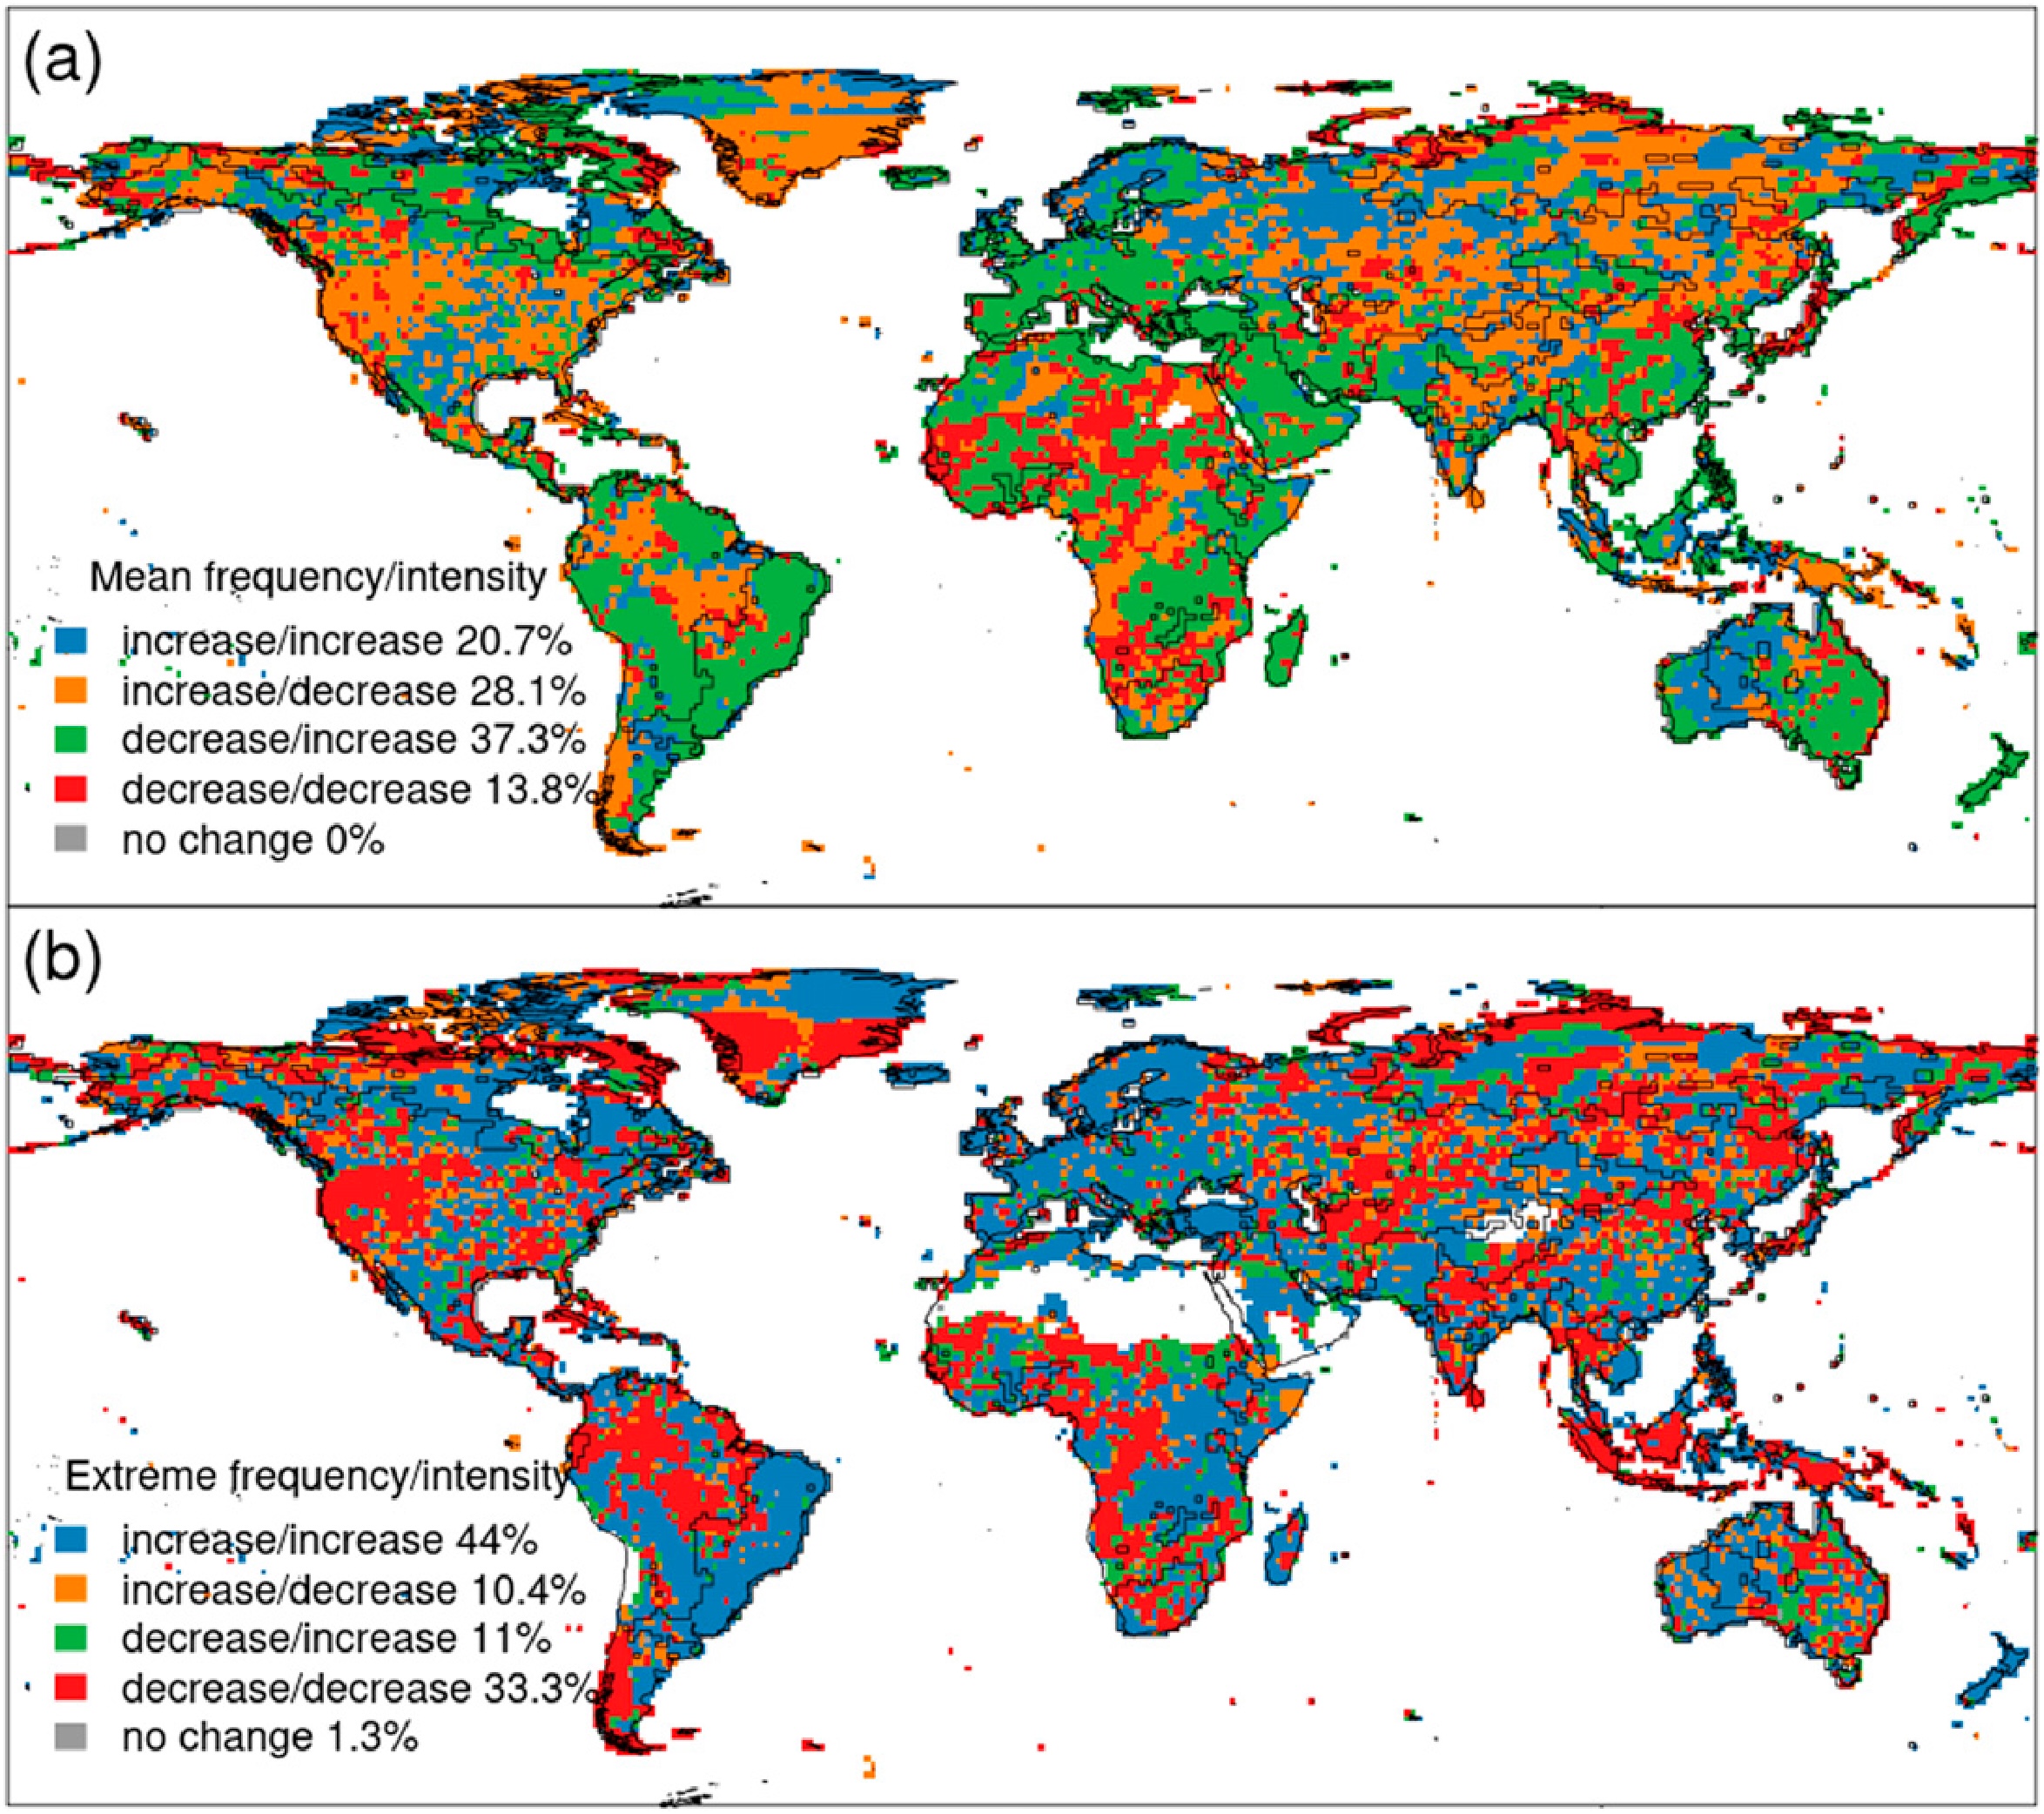
Synchronous changes between frequency and intensity
- Mean changes in frequency and intensity are aligned in only around 1/3rd of the grids
- Extreme changes in frequency and intensity are aligned in almost 80% of areas globally
(My ideal) Future of climate datasets
- All “observational” datasets are estimates from a statistical model consisting of aleatoric and epistemic uncertainties
- If we stop thinking of observations as immutable facts and instead think of them as data generating models than we can ask more meaningful questions
- E.g. for validation studies, instead of doing a grid cell by grid cell comparison we can calculate the conditional probability of the model output given the observations
- To do this we need observations to be inherently probabilistic (the entire distribution), e.g. Risser et al. 2019
- Artificial intelligence assisted inference can alleviate computational bottlenecks that traditionally made inference algorithms impractical in climate sciences, e.g. Zammit-Mangion et. al 2021 and Lenzi et. al 2023
- As the examples demonstrate even a dataset of extremes is possible with this approach
Risser, M. D., Paciorek, C. J., Wehner, M. F., O’Brien, T. A., & Collins, W. D. (2019). A probabilistic gridded product for daily precipitation extremes over the United States. Climate Dynamics, 53(5), 2517–2538.
Zammit-Mangion, A., Ng, T. L. J., Vu, Q., & Filippone, M. (2021). Deep Compositional Spatial Models. Journal of the American Statistical Association, 0(0), 1–47.
Lenzi, A., Bessac, J., Rudi, J., & Stein, M. L. (2023). Neural networks for parameter estimation in intractable models. Computational Statistics & Data Analysis, 185, 107762.
Thank you